Decorating using @interact:
- Andrea Osika
- Dec 28, 2020
- 3 min read

Updated: Dec 28, 2020
I saw a post on a colleague's LinkedIn today on a topic I haven't played with for many moons. I had just shared with him that I was feeling a little out of the coding game just before I saw his post. He was looking for inspiration on where to use decorators in his coding. I consider the guy a coding machine, AND I think the topic is really fun so I thought I'd revisit. Heck, maybe even inspire him just to see what he does with it.
Besides being cool looking and keeping things tidy, decorators are functional and powerful. They amplify efficiency since they build on top of an existing function and add on to it without changing the original form. When I was learning about them I heard the term 'wrapper' and in my mind, it makes more sense as far as describing what it does. It 'wraps' a function in another function.
I stumbled upon them when I was beginning some EDA in a series of hypothesis testing. The goal: to visualize whether or not a discount affected the quantity purchased.
Here's where I was in my notebook. In the code below, I'm just finding out the average quantity purchased, how many samples I'm dealing with, and how many discounts there were:
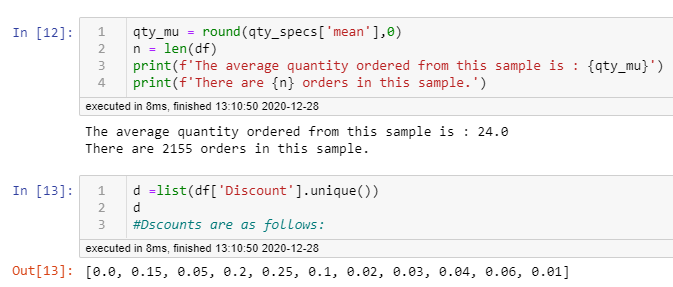
I count 11 discounts (and who offers a 1% discount? Also, I misspelled Dscounts... I digress).
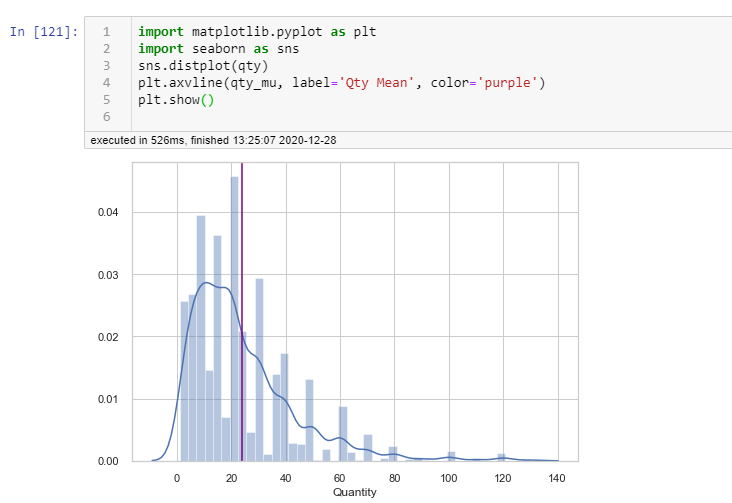
All this text made me want to "see" what things looked like in terms of distribution. This plot didn't really tell me too much:
I wanted to see if visually, it was apparent that the quantity ordered shifted away from the sample average of 24 depending on the discount offered. A look at a histogram for each discount (I'm very visual) could be helpful. But, this meant 11 plots.
I wrote a function since we know how functions break up pesky repetitive code:
def plt_discounts(d=d):
    sns.distplot(df.groupby('Discount').get_group(d)['Quantity'])
    plt.axvline(qty_mu, color='purple')
This helped, and I could write a loop to show me all 11 plots... but that takes up so much room in a notebook. I repeat: I'm visual, but 11 plots = overwhelming.
Enter @interact. This particular decorator is a widget - which allows GUI interaction - think sliders, radio buttons used to generate a response. In this case, a drop-down menu helped de-clutter my notebook.
When I installed it and layered it on top of my existing function I loved it. It was EXACTLY what I wanted/needed. To call them, you use an @ right before the decorator and then build your function right below it:
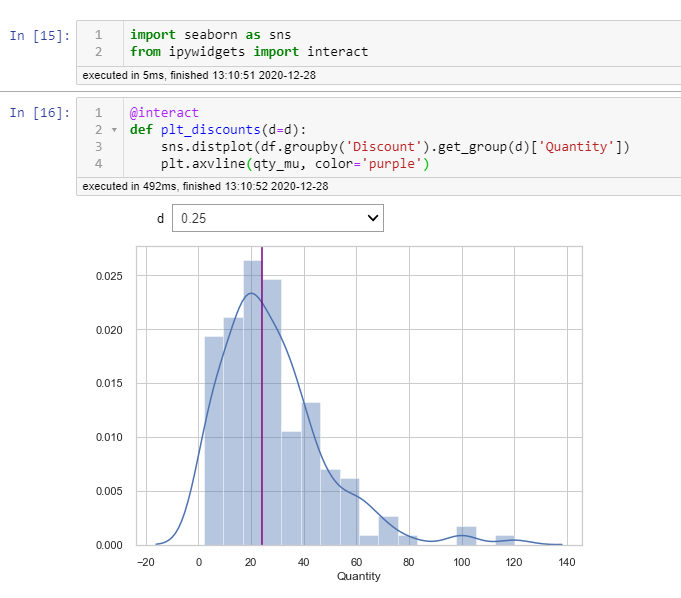
Cool, right? By clicking the GUI dropdown menu, the appropriate plot displayed allowing me to see quantity distributions along with mean. This helped out with EDA while not jamming up my notebook. I'd have to do actual hypothesis testing to figure out if there was a significant difference, but I'd loved this little rabbit hole and thought of other ways I could use this. For example: sometimes when I'm modeling my data, I need to transform it. This affects how it's displayed visually. In this case, I could create a wrapper that tweaks and adapts what exists without starting from scratch, 'just build it right on top.
If this is new to you though, I want to make sure you are following along:
Function: a block of code that only runs when it is called. You can pass data, known as parameters, into a function. A function can return data as a result.
Decorator: An object that wraps a function and adds functionality without modifying it. Decorators can also inherit other decorators and override specific parts of a particular function.
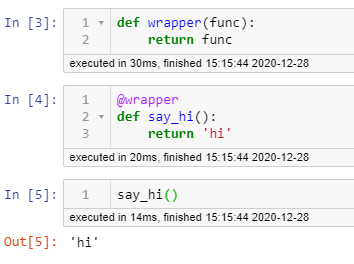
You can write your own. This one is literally more decorative than anything. It isn't as practical as @interact, but it will show you the 'innards' of how these decorators are constructed.
So here I create a super basic function:
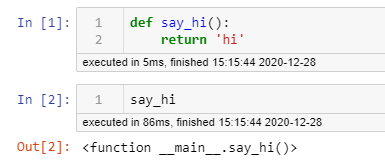
and build a wrapper... this one really does nothing. Are you underwhelmed? That's ok. The idea is to simply show the basic structure and how to call them. See how I layer the one using the @ symbol on top of the other function? This allows modularity. You can keep components one way and override others as you go on the fly.
Here's one literally slightly more exciting, but again... the idea is to show you how they work:
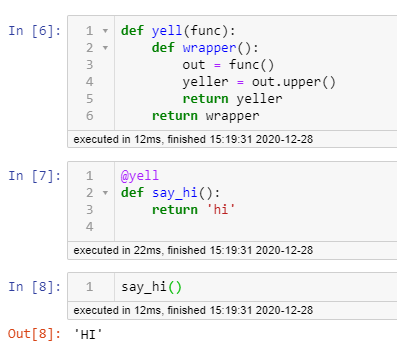
The beauty and power of decorators is the modularity. You can chain them on top of each other as I found in this tutorial that can augment what I offer here and explain chaining - I'm intrigued! Take what you want, leave the rest. This too will leave your notebooks tidy and functional which is what I was looking for in the first place.
Happy decorating!
More reading:
The notebook I talk about re: hypothesis testing and code can be found here
Other stuff:


Comments