Latent Dirichlet Allocation: Topic Extraction in Natural Language Processing
- Andrea Osika
- Sep 22, 2020
- 6 min read

Question:
What do people like in all those fitness and wellness apps anyway?

When you’re reading an article, review, or book, extracting meaning is the point. But when you must read thousands and thousands of articles, reviews, or books extracting meaning becomes a bit of a challenge. It can be overwhelming to consider extracting and cataloging and tagging topics while reading, especially considering that some words can overlap topics. Sometimes words that can help classify a review as a five or one-star are useless in telling you what you’re doing right or wrong.
Enter: Latent Dirichlet Allocation or LDA. When used for natural language processing, the model takes in a dictionary of words – or all the words used across multiple documents or in my case - thousands of customer reviews for the top five health and wellness apps. I'm a bit of a fitness/wellness fanatic and wanted to know what people were saying was so great or not so great about these apps after a visit to App Annie.
If you were curious, they are:
I've used most of them - ask me about them if you want. All except BetterMe(Me)..I digress...
I took ten thousand from each – fifty thousand of the most relevant reviews using google play scraper. Five and one-star reviews were most frequent - this made sense since the best and worst seem the most likely to be relevant to readers. I assigned content to be ‘good’ if it was assigned a five-star review, ‘bad’ if it was a one-star review, and content that received two - four stars and contained less persuasive content as ‘neutral’. Then I began to dig deeper into the good and bad reviews.
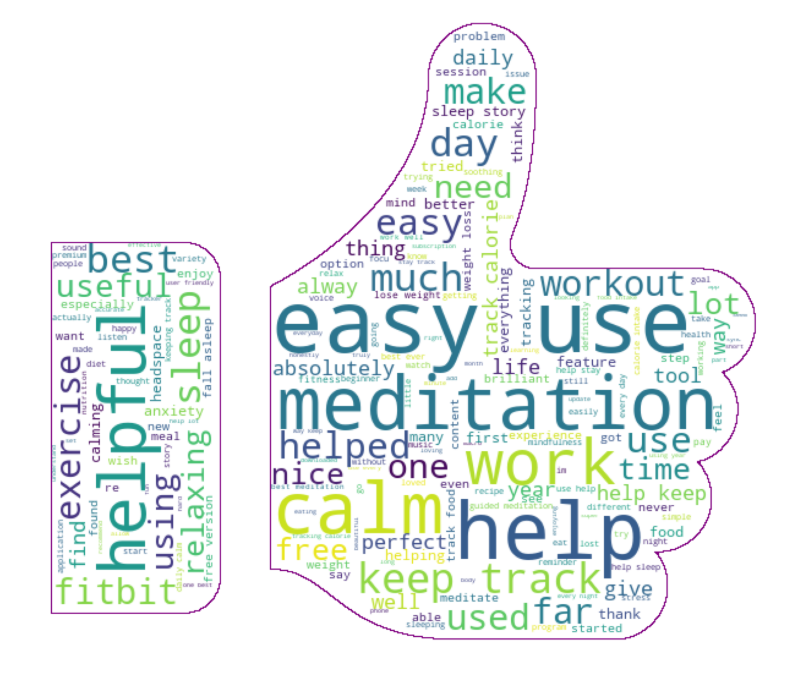
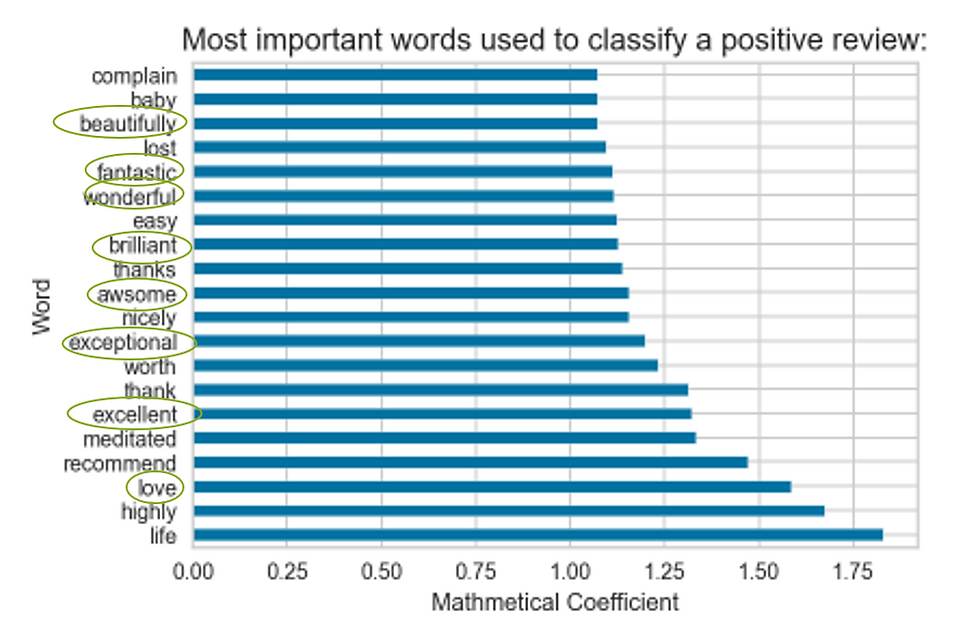
In each category, I removed adjectives that didn’t tell me much in terms of real product insight - words like “awesome” or “rubbish” and began some cluster analysis using traditional segmentation using KMeans to “see” if I could notice trends. I struggled.
KMeans seemed to limit since:
1) Terms can only belong to a single topic.
2) Visualizing and explaining results to others is just plain challenging. The options are either bar charts or word clouds for term probabilities for each topic. Pie charts could theoretically be implemented based on word frequency and scatterplots could inform metadata. Viewing the terms in how they related to each other along with relevance and topic exclusivity the degree to which its occurrences seemed daunting....
Re-enter LDA: genism has a tool they’ve developed that seemed to address the challenges for this project. Check it out:
LDA or topic modeling gives you a probabilistic composition of the document using the dictionary. In addition, it gives you topics that are probability distributions over words. This model is a mixture model – it considers that there are subpopulations in an overall population without requiring an observed dataset belong to the same subpopulation to which the individual observation belongs to. Challenge number 1 addressed.
It has two main components:
1. the [distribution of the] number of words per topic is handled by eta. The more words you're interested in per topic, the higher the eta.
2. the [distribution of the] number of topics per document is handled by alpha. When lambda equals one – we can see where terms land solely using probability. A lower lambda distributes the probability mass on a few topics for each document.
Back to the app reviews. From the fifty thousand reviews, I grouped the good and bad reviews. For each, I created a list of lists... my 'documents' were the 'content' field of my data frame. This contained the text data of reviews that had been pre-processed. I took out stopwords or words like 'a', 'the', 'and', removed punctuation and lemmatized them in addition to taking out those adjectives I talked about before - 'wonderful', 'worst'
The code looked like this:
#for LDA.Dictionary we need a list of list of tokens:
neg_list_of_lists = []

for row in df['content']:
    neg_list_of_lists.append(row)

neg_list_of_lists
Then I began to build my model. These are tough to reproduce exactly the same each time, but setting a random seed helps. I bumped up my eta in hopes to form topics being more similar in terms of what words they contain.
from gensim import corpora, models

np.random.seed(41)

#instantiating the Dictionary, pulling out the words that occur less than 3 times and
#creating the corpus:
dictionary_LDA = corpora.Dictionary(list_of_lists)
dictionary_LDA.filter_extremes(no_below=3)
corpus = [dictionary_LDA.doc2bow(list_of_tokens) for list_of_tokens in neg_list_of_lists]

#as indicated by elbowplot:
num_topics = 5
#instantiating the model
%time lda_model = models.LdaModel(corpus, num_topics=num_topics, \
                                  id2word=dictionary_LDA, \
                                   passes=10, alpha=[0.1]*num_topics, \
                                   eta=[0.5]*len(dictionary_LDA.keys()))
This gave me my model. From there, I just wanted to get an idea of what the topics looked like. These are from the negative reviews:
#to see in each topics what words are associated with them:
num_topics = 5
for i,topic in lda_model.show_topics(formatted=True, num_topics=num_topics, num_words=5):
    print(str(i)+": "+ topic)
    print()
which rendered :
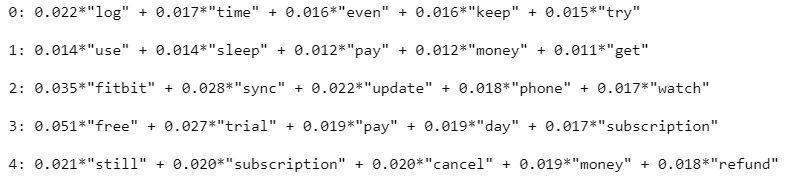
See? You can begin to pick up on patterns of what people are 'talking' about. In topics 1, 3, and 4 you can see billing is an issue. Words like 'free', 'trial', 'cancel', and 'subscription' one can conclude what's going on. People don't like getting charged after the free trial. In diving deeper into the reviews, I was surprised that billing terms occupied 37% of the overall topic frequency. I fully expected to see the technical issues and was able to see in some cases what these were amongst the apps. But how could I explain this more easily? I'm a visual person. And positive. Let's focus on the positive reviews next.
With the model built, and shifting over to the positive reviews, the magic:
#code for instaciating and visualizing interactive lda model:
np.random.seed(41)
%matplotlib inline
import pyLDAvis
import pyLDAvis.gensim
%time vis = pyLDAvis.gensim.prepare(topic_model=lda_model, corpus=corpus, dictionary=dictionary_LDA)
pyLDAvis.enable_notebook()
%time pyLDAvis.display(vis)
Which rendered this:
Placement occurs via multidimensional scaling onto a 2d plot using Principal Component Analysis or PCA. They are ordered by the percentage of variability they explain. PC1 on the x-axis always explains more variability among the samples included in the test. PC2 is the second axes explaining more variability.
As this plot is created, topics appear as bubbles. The centers are determined by figuring the distance between topics, then using multi-dimensional scaling. The bigger the bubble, the more frequent the topic across the corpus – informing the users which topics are most frequently talked about. What's more: It's interactive! TRY IT! By clicking on each bubble, a list of the most relevant words in each topic appears in the right panel and is determined by their frequency as well as their occurrence across the corpus. By clicking on each term, you can see what topics it occurs in.
To answer the question, what do people like? They like app-specific features to help them achieve whatever it is they seek - better sleep, meditation cues (bubbles marked 1 and 2) these well-being topics took up 49% of positive review discussion. Information/Data (bubbles marked 4&5) came in second at 25% - not surprising... who doesn't love metrics?! Ease of use can be extracted as a topic in bubble number three and clearly weight loss (app-specific feature) came up in topic 6. I think it would be interesting to dive further down this rabbit hole and model for each app specifically. Maybe next project? I had my answers.
I digress again... more about the model:
While sensible topics are created, a common issue is 'junk' topics or topics that don't seem coherent. Model outputs need to be verified by subject matter experts and modified accordingly. This can be also be tuned via trial and error or by using a coherence score.
#evaluating model
from gensim.models.coherencemodel import CoherenceModel
# Compute Coherence Score using c_v
coherence_model_lda = CoherenceModel(model=lda_model_pos, texts=pos_list_of_lists, dictionary=dictionary_LDA_pos, coherence='c_v')
coherence_lda = coherence_model_lda.get_coherence()
print('\nCoherence Score: ', coherence_lda)
Coherence scores of .1-.4 are low, .5 is ok, .6-.7 are about as good as you can get and .8-.9 are just plain unlikely. For the record, mine was ok: .52 'not bad for a first-timer. I'll continue to tweak it.
Note that both procedures are considered unsupervised learning and far from being perfect, no matter how impressive the results may look at first sight. LDA helped me understand what the topics were with words leading the way. The interactive tool helped me to explain it to others. Challenge 2 addressed.
I was able to build a model actually that helped me predict where a review would land based on the text, then what topic it would end up in, but that's a little/lot more involved. For the project, you can visit it on my GitHub.
More reading on LDA:


Comments