One way to remove outliers:
- Andrea Osika
- Mar 25, 2021
- 3 min read

Outliers. The world is an imperfect place - full of random, imbalanced, non-normal data.
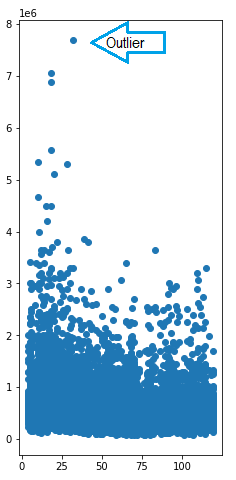
Outliers are the data that doesn't 'match' the rest of the data being evaluated. In the image to the right, it's obvious that one of these data points doesn't look like the others. There are actually a couple. Our eyes can interpret them as being 'out there'. But what about the ones that aren't exactly 'out there. Is there a way to draw the line between those that belong to the data set and those that are true outliers?
According to math, yes. One way to do this is to compare that outlier with the average and assign it a standard score, or z-score.
I introduce the z-score in this other blog in this case I used this score to help calculate an acceptable sample size. This z-score can come in handy as a way to identify outliers. To calculate them you need:
1) the mean (central value)
2) your score
3) the standard deviation (this needs a little more explaining if you ever spaced out in statistics, see below)
Standard Deviation Rabbit Hole For Those Who Need It:
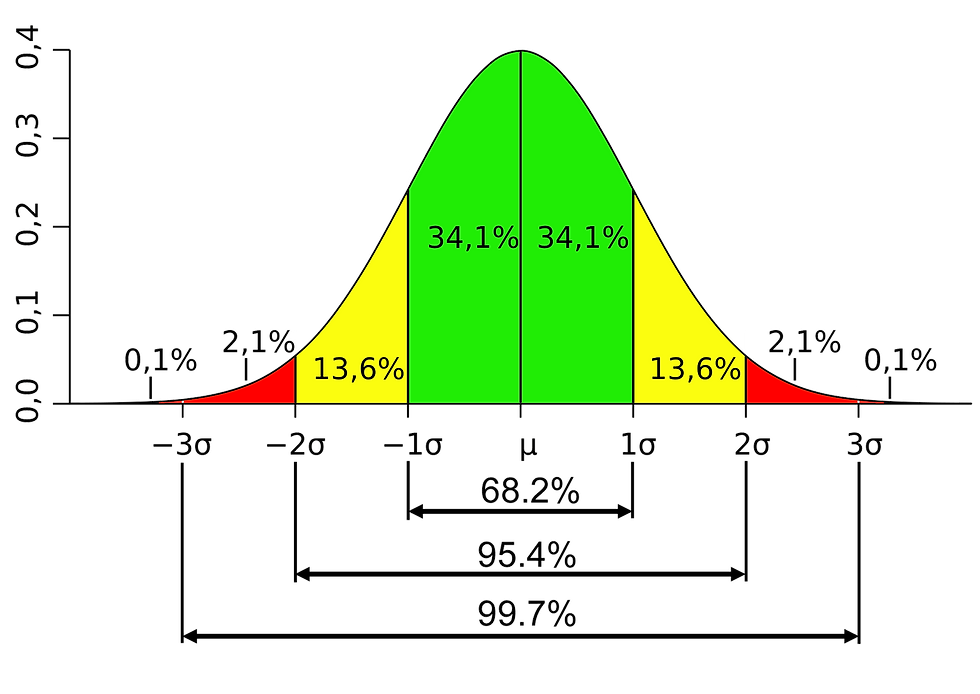
Let's start with a normal distribution of data - or a bell curve. The reason for this shape of a bell is based on the central limit theorem. - or the theorem that states that when randomized data is collected from a population, the probability of the majority of the data is distributed in the middle and gradually tapers towards the ends. Like a bell.
Look below. In this image, the green represents 68.2 % of the data distribution and is located in the middle. This is within one standard deviation of the mean. Those that are within two standard deviations (yellow + green) represents 95.4% of the distribution and three represents 99.7%. So anything that's outside of three standard deviations is considered to represent .15% on either side of the curve and it's fairly safe to call that an outlier.
Now that we have all three, we can calculate the zscore:
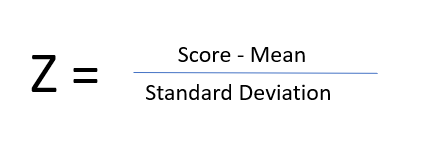
Basically it's a normalized value that represents how many standard deviations you are from the mean. In general, it's a scale of -3 to 3. A negative score means it's less than the mean, positive means it's above the mean and 0 means it's the most average of average. If something is beyond that - it's not normal aka an outlier.
There are tables to help with this: http://www.z-table.com/
For a large dataset, this could get computationally expensive. When I'm working on something in Python, I import the package from scipy stats to do the work for me. Basically, I use this method sometimes to remove outliers when I see fit.
I made this simple function to quickly identify outliers if I decide that I want to remove them.
def find_outliers_Z(data,col=None):
    """Use scipy to calcualte absoliute Z-scores
    and return boolean series where True indicates it is an outlier

    Args:
        data (DataFrame,Series,or ndarray): data to test for outliers.
        col (str): If passing a DataFrame, must specify column to use.

    Returns:
        [boolean Series]: A True/False for each row use to slice outliers.

    """

    from scipy import stats
    import numpy as np
    import pandas as pd

    if isinstance(data, pd.DataFrame):
        if col is None:
            raise Exception('If passing a DataFrame, must provide col=')
        else:
            data = data[col]
    elif isinstance(data,np.ndarray):
        data= pd.Series(data)

    elif isinstance(data,pd.Series):
        pass
    else:
        raise Exception('data must be a DataFrame, Series, or np.ndarray')

    z = np.abs(stats.zscore(data))
    idx_outliers = np.where(z>3,True,False)
    return idx_outliers
If I were in python using pandas and wanted to find the outliers, I'd use this code to generate the index of those values that were the z score was higher than 3 to indicate it was outside of three standard deviations:
idx_outs = find_outliers_df(df,col='AdjustedCompensation')Feel free to copy and use this function in your data cleaning if it applies. I found myself hanging on to it for cases when I needed to identify outliers. Sometimes this might yield a high number of outliers - in which case removing them might skew testing results. If there are just a few that are obvious and we want to isolate them from the main dataset:
We can just create a new dataset that does NOT contain the statistical outliers.
good_data = data[~idx_outs].copy()Feel free to copy and use this function in your data cleaning if it applies. I found myself hanging on to it for cases when I needed to identify outliers.


Comments